
Daily English ProDaily English Pro
Full Mock
Practice
IELTS Tools
IELTS GuidesNew
Log in
Start for Free

Daily English ProDaily English Pro

Professional IELTS mocks, practice, and AI feedback from Daily Native English.

© 2026 Daily English Pro. All rights reserved.

Product

  • Full mocks
  • Pro library
  • Start free

Practice

  • Listening
  • Reading
  • Writing
  • Speaking

IELTS Tools

  • Writing Checker
  • Score Calculator
  • Score Converter
  • Band Descriptors
  • eBooks

IELTS Guides

  • All IELTS Guides
  • IELTS Exam Format Sections and Timing (2026)
  • IELTS Academic vs General Training Choice (2026)
  • Computer vs Paper IELTS How to Choose (2026)
  • IELTS Study Plan for 30 60 90 Days
AboutPrivacy PolicyTerms of ServiceContactdailyenglishbusiness@gmail.com
IELTS Guides/Writing/IELTS Academic Task 1 Pie Chart Tips (2026)

IELTS Academic Task 1 Pie Chart Tips (2026)

Describe IELTS Academic Task 1 pie charts with share language, combined small slices, proportion vocabulary, and clear two-pie comparisons over time.

11 min read·Published Sep 14, 2026

On this page

  1. 1. Treat pie charts as shares of a whole
  2. 2. Combine small slices and select major shares
  3. 3. Use proportion vocabulary with accurate grammar
  4. 4. Compare two pies over time
  5. 5. Pie chart FAQ and next step

Treat pie charts as shares of a whole

A pie chart shows how parts make up 100 percent of a whole at one moment. Your description should emphasise proportions: which share is largest, which is smallest, and how the remaining categories relate. Absolute ranking language still helps, but share vocabulary is the natural fit.

Read the title carefully to know what the whole represents, such as household spending or energy sources. If two pies appear, check whether they show different years, places, or groups. That relationship decides whether your overview focuses on change over time or on cross-group contrast.
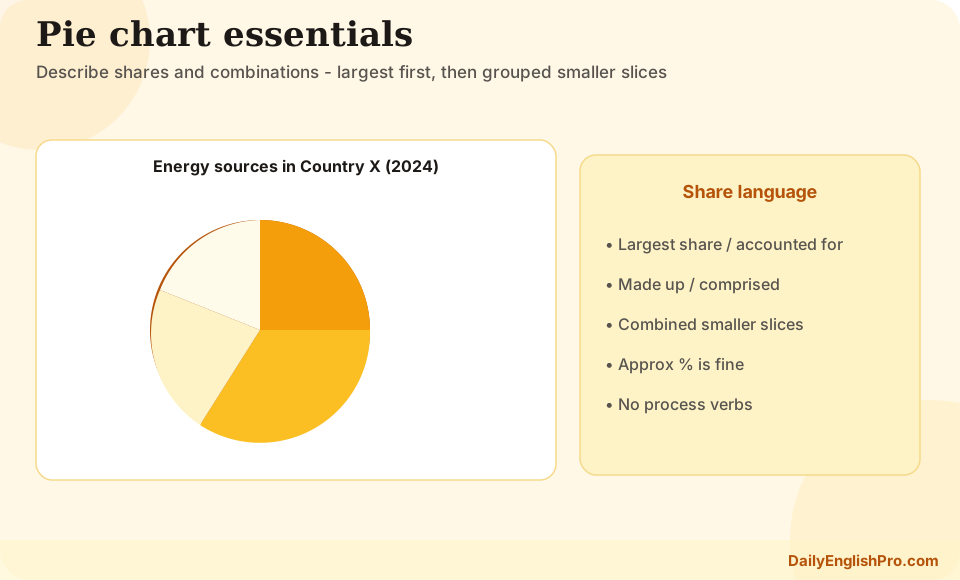
IELTS Academic Task 1 pie chart guide showing major shares, minor slices, and a two-pie comparison layout
Identify the whole, the dominant slices, and whether a second pie invites a time or group comparison.

★ Shares, not stories

Report proportions accurately. Do not explain why a slice is large unless the question asks for that, which standard Task 1 prompts do not.

Combine small slices and select major shares

Crowded pies often include several tiny categories. Combining them in one sentence keeps the response readable: The remaining categories, including books and other items, each accounted for under 5 percent. This is selection, not omission of the whole picture, provided the overview still reflects the true distribution.

Give precise attention to the largest one or two slices and to any category that changes rank between pies. Mid-sized shares can be grouped when they are similar. Aim for a controlled set of figures rather than a full catalogue of every percentage.

  • ✓Name the largest share in the overview
  • ✓Mention the smallest share if it is distinctive
  • ✓Combine several minor slices in one summary sentence
  • ✓Select about six to eight percentage figures in total
  • ✓Keep category labels faithful to the chart key
Share sizeUseful languageExample
Dominantaccounted for the largest share, made up just over halfHousing accounted for the largest share at 52%
Majorrepresented around a quarter, comprised nearly 30%Transport represented around a quarter of spending
Minora small proportion, only a tiny shareEntertainment made up only a tiny share
Combined smallthe remaining categories, other items togetherOther items together came to under 10%

Use proportion vocabulary with accurate grammar

Core verbs include accounted for, made up, comprised, and represented. Noun phrases such as the largest proportion, a minority share, and an equal split also work well. Fractions can vary the style: roughly one third, just under a half, about one in ten. Switch between percentages and fractions only when both remain clear.

Watch subject-verb agreement and article use. Spending on food accounted for 20 percent is safer than Food were 20 percent. If two categories are equal, say they each made up the same proportion rather than forcing a false ranking.

Weak

Awkward wording

Food was 25% and transport was 20% and housing was 40% and other was 15%.

  • •Pure listing
  • •No ranking language
  • •No grouping

Stronger

Share-focused wording

Housing made up the largest share at 40%, while food and transport together accounted for 45%. Other spending was the smallest slice.

  • •Clear hierarchy
  • •Combined related idea
  • •Natural proportion verbs
  • Task 1 chart vocabularyExpand proportion, comparison, and approximation phrases.Read More →
  • Overview tipsState the dominant shares without dumping every percentage.Read More →

Compare two pies over time

Two pies from different years usually need an overview about change: which categories grew as shares, which shrank, and whether the leading category stayed the same. Then give one body paragraph to the larger shifts and another to stable or minor categories. Comparing the same category across years is clearer than finishing the first pie completely before starting the second.

Be careful with language of change. A slice rising from 10 percent to 25 percent means that category became a larger share of the whole. It does not automatically prove that the absolute amount doubled unless the chart also shows totals. Stick to what the percentages show.

  1. 1Identify the linkConfirm whether the pies show two years, two places, or two groups.
  2. 2Overview the shiftName the categories that gained or lost share and whether leadership changed.
  3. 3Detail major moversGive paired percentages for the biggest increases and decreases.
  4. 4Summarise the restGroup stable or tiny slices so the response stays selective.
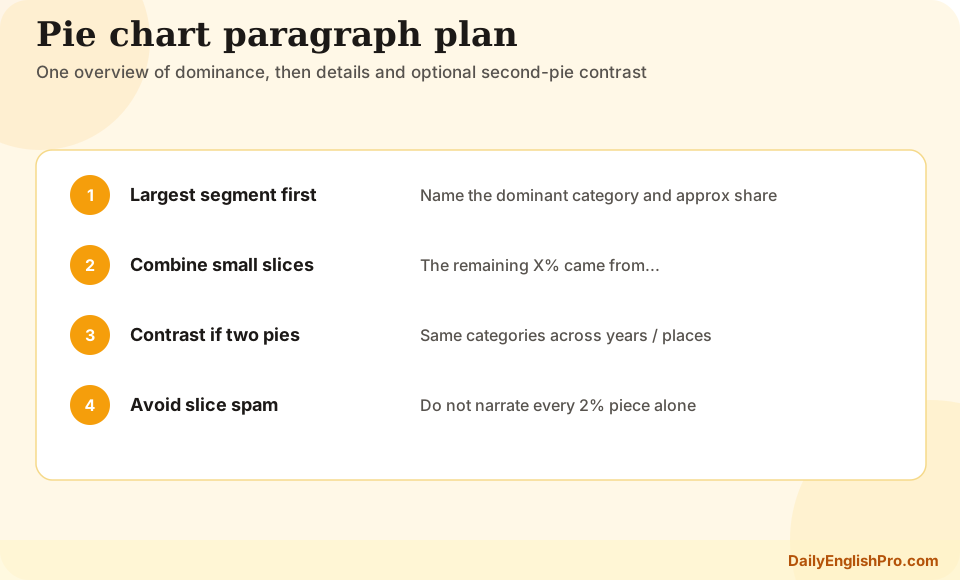
IELTS Task 1 two-pie comparison structure with shared overview and category-paired detail paragraphs
For two pies, compare the same categories across visuals rather than writing two separate reports.

Pie chart FAQ and next step

Practise with one single pie and one paired-pie task. For each, write the overview first and limit yourself to eight figures. Then check whether small slices were combined cleanly.

Must I mention every slice?+

No. Cover the main shares fully and combine minor slices. The overview should still reflect the true balance of the chart.

Can I use fractions instead of percentages?+

Yes, if they remain accurate. Roughly one third or just under a half can vary your style, but do not force awkward fractions.

How should I compare two pies from different years?+

State the main share changes in the overview, then pair the same categories across years in the body paragraphs.

Is it wrong to say a category doubled?+

Only use doubled when the percentage evidence supports that claim. A rise from 10% to 20% is a doubled share, but do not invent absolute totals the chart does not give.

Check a Writing draft next

Get TR / CC / LR / GRA notes on your next essay.

Start for Free
4.8

From 500+ reviews

Before

6.5

30 days→

After

8.0

Continue practising

  • Academic Task 1 guide →
  • Chart vocabulary →
  • Task 1 overview tips →
  • Table tips →
  • Mixed chart tips →

More in Writing

View all →

Updated Sep 14, 2026

IELTS Academic Writing Task 1 Essential Tips

Read More →

Updated Sep 14, 2026

IELTS GT Writing Task 1 Letter Tips

Read More →

Updated Sep 14, 2026

IELTS Writing Task 2 Essay Types Explained Clearly

Read More →

Updated Sep 14, 2026

IELTS Task 2 Agree Disagree Essay Tips (2026)

Read More →

Updated Sep 14, 2026

IELTS Task 2 Discussion Essay Tips (2026)

Read More →

On this page

  1. 1. Treat pie charts as shares of a whole
  2. 2. Combine small slices and select major shares
  3. 3. Use proportion vocabulary with accurate grammar
  4. 4. Compare two pies over time
  5. 5. Pie chart FAQ and next step

Check a Writing draft next

Get TR / CC / LR / GRA notes on your next essay.

Start for Free

Before

6.5

30 days→

After

8.0