
IELTS Academic Task 1 Mixed Charts Tips (2026)
Write IELTS Academic Task 1 mixed chart answers for bar plus line or pie plus table, with one shared overview, one body per visual, and clear linking.
Recognise what mixed charts share
Mixed chart tasks present two visuals that belong to one topic, such as a bar chart of category totals beside a line chart of change over time, or a pie chart of shares beside a table of related figures. Your response must cover both visuals and show how they connect. Treating them as unrelated mini-tasks usually weakens Task Achievement and cohesion. Confirm Academic Task 1 on the IELTS test format (IELTS.org).
Begin with a paraphrase that names both visuals and the shared topic. Then look for the relationship: does one chart explain composition while the other shows change, or does one give totals while the other breaks down percentages? That relationship becomes the heart of the overview. Official Task Achievement: IELTS Writing band descriptors (IELTS.org PDF).
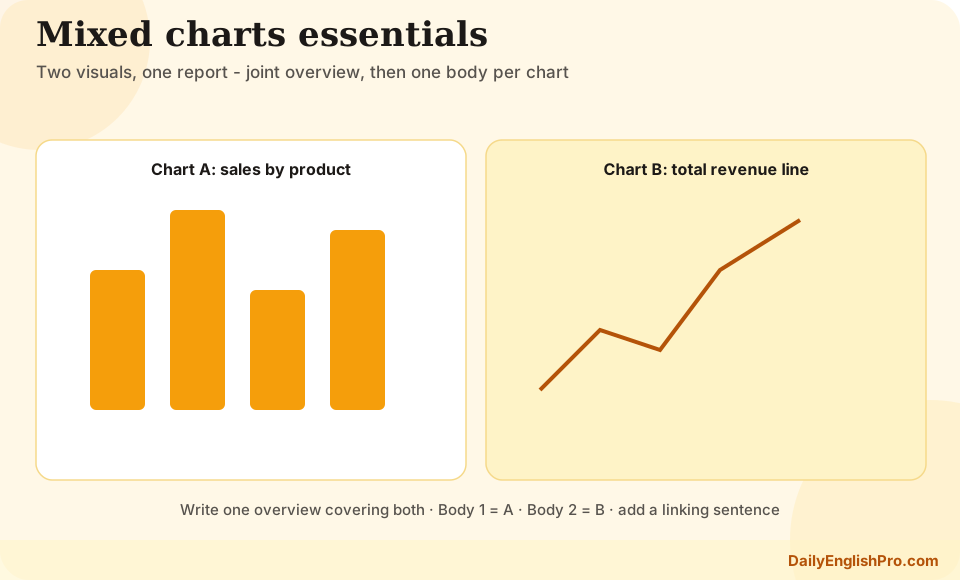
Write one overview that covers both visuals
Do not write two separate overview sentences that never meet. Combine the main idea from each chart into a short paragraph. For a bar-plus-line task, you might note that Category X was the largest throughout, while the line chart shows that overall demand rose. For a pie-plus-table task, you might say that one sector dominated the shares, and the table shows that this pattern was clearest in a particular group or year.
Keep the overview free of dense figures. Its job is to tell the examiner you have seen both visuals and understood their joint message. If the charts appear to conflict, describe the contrast carefully rather than ignoring one side.
| Combo | Overview should capture | Typical body split |
|---|---|---|
| Bar + line | Leading category plus overall trend | Body 1 bars, Body 2 line |
| Pie + table | Dominant share plus key table contrast | Body 1 pie, Body 2 table |
| Two related bars | Shared ranking pattern or clear divergence | One body per chart, with cross-links |
| Line + table | Main movement plus standout table values | Trend first, then selected table cells |
- Overview tips - Practise figure-free overviews that still sound precise.
- Chart vocabulary - Keep comparison and trend language ready for mixed tasks.
Give each visual a body paragraph
The most reliable structure is introduction, one joint overview, body paragraph for visual A, and body paragraph for visual B. This prevents the details from colliding and makes coverage obvious. Inside each body, use the same selection habits you would use for that chart type alone: extremes, key years, major shares, or selected table cells.
Balance matters. If one chart is denser, it may need slightly more detail, but do not abandon the simpler visual. Examiners expect both sources of information to contribute. Select figures that support the joint overview rather than opening a new unrelated story in the second body.
- 1Paraphrase both visualsName the chart types and the shared topic in one or two sentences.
- 2Draft a joint overviewCombine the main message of each visual into one short paragraph.
- 3Detail visual ASelect key figures for the first chart using an appropriate grouping method.
- 4Detail visual B and linkOpen with a linking sentence, then report the second chart's key evidence.
- Cover both visuals fully enough to support the overview
- Avoid copying the same figure into both paragraphs without purpose
- Keep total selected figures manageable across the whole answer
- Leave speculation and causes out of Task 1
Use linking sentences between the visuals
Cohesion is often the difference between an average mixed-chart answer and a clear one. Start the second body with a bridge: Turning to the line chart, which shows change over the same period... or While the pie chart focuses on shares in 2020, the table compares the figures by age group. These sentences tell the reader why the next data set appears.
You can also make light cross-references inside a paragraph when a number in one visual helps interpret the other. Keep these links factual. The goal is orientation, not a long analytical argument.
Weak
Disconnected bodies
Body 1 ends. Body 2 begins with The table shows... and never refers to the first chart.
- •Feels like two answers
- •Joint overview is wasted
- •Weaker cohesion
Stronger
Linked bodies
Body 2 opens by relating the second visual to the first, then adds selected detail.
- •Clear transition
- •Shared topic stays visible
- •Easier for the examiner to follow
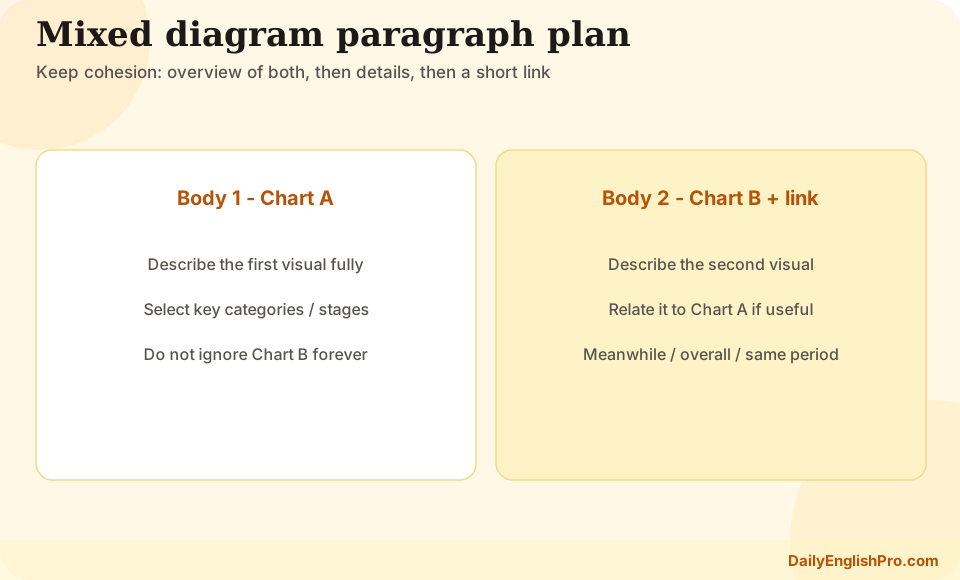
Common mixed-chart combinations
Bar-plus-line tasks often pair category comparison with a trend. Describe which categories dominate, then show how a related total or average moved over time. Pie-plus-table tasks often pair composition with a second breakdown. Summarise the main shares, then use the table for the most important cross-category or year contrasts.
If you also practise maps and process diagrams, reuse the same discipline: one clear overview, organised detail, and no forced narrative beyond the visuals. Mixed charts are different in format, but the selection principle is the same.
- Maps strategy - Practise overview and grouping on map tasks.
- Process diagrams - Transfer clear sequencing and overview skills to process tasks.
Mixed charts FAQ and practice
Train with a four-minute plan: paraphrase, joint overview bullets, figure list for chart A, figure list for chart B, and one planned linking sentence. Then write the full response and check that both visuals are represented in the overview.
Do I need two overviews for mixed charts?+
No. Write one overview that covers the main point of both visuals. Separate overviews often feel disconnected.
Is one body paragraph per visual necessary?+
It is the clearest default. You may combine details only when the charts are tightly paired and your grouping stays easy to follow.
What if the two charts use different units?+
State the units clearly when you switch visuals and avoid direct numerical comparisons that the scales do not support.
How long should a mixed-chart answer be?+
Aim for at least 150 words, as in all Task 1 responses. Selective coverage of both visuals matters more than extreme length.